
4. The Cryosphere
Ice. Other than being simultaneously beautiful and terrifying, it has a huge impact on not only studies of the origins of climate change, but also the effects of it manifesting. 44 percent of the world’s population lives on coastlines, and rising sea level due to anthropogenic causes is already underway. Our guest for this chapter of the IPCC report was Tad Pfeffer. He went into detail to explain and integrate knowledge of Cryosphere observations into the bigger picture of climate change.
The most important aspect to this information is how melting continental ice sheets contributes to sea level rise, and how we contribute to the melting of these ice sheets.

Ice. Other than being simultaneously beautiful and terrifying, it has a huge impact on not only studies of the origins of climate change, but also the effects of it manifesting. 44 percent of the world’s population lives on coastlines, and rising sea level due to anthropogenic causes is already underway. Our guest for this chapter of the IPCC report was Tad Pfeffer. He went into detail to explain and integrate knowledge of Cryosphere observations into the bigger picture of climate change.
The most important aspect of this information is how melting continental ice sheets contributes to sea level rise, and how we contribute to the melting of these ice sheets. The IPCC summarized a few key statements from the overview of the report about ice. From the second slide presented by Pfeffer (those claims are italicized), I will explain in greater depth each of these claims.
Over the last two decades, the Greenland and Antarctic ice sheets have been losing mass, glaciers have continued to shrink almost worldwide, and Arctic sea ice and Northern Hemisphere spring snow cover have continued to decrease in extent (high confidence). The Greenland and Antarctic Ice sheets have been losing mass at an incredible rate. These sheets are more worrying than sea ice because they will contribute to seal level rise and they alter regional salinity and atmospheric circulation.

From 1998 to 2012, it appears we have lost nearly 3,000Gt of ice on the Greenland Ice sheet, and the Antarctic has lost nearly 2,000Gt of ice since that time. Additionally, the rate at which we lose the ice is rising rapidly, and the mean snow cover in the Northern Hemisphere has decreased significantly over the last years culminating to a low point in June around 2010.
Even permafrost has risen in temperature, creating more of an active layer. This active layer supports plant life, but there is CO2 stored in the permafrost from plants that have been frozen in a live state. The more that permafrost melts, the more CO2 it releases into the air.
The rate of sea level rise since the mid-19th century has been larger than the mean rate during the previous two millennia (high confidence). Over the period 1901 to 2010, global mean sea level rose by 0.19 [0.17 to 0.21] m. This was mentioned briefly in the last entry, but is important enough to be reiterated. This graph below shows the relation between year and sea level rise and the results do not look good, unless you are a fish, and even then you have a whole other host of problems.
It is very likely that the Arctic sea ice cover will continue to shrink and thin and that Northern Hemisphere spring snow cover will decrease during the 21st century as global mean surface temperature rises. Global glacier volume will further decrease. Global mean sea level will continue to rise during the 21st century. Under all RCP scenarios, the rate of sea level rise will very likely exceed that observed during 1971 to 2010 due to increased ocean warming and increased loss of mass from glaciers and ice sheets.
Glaciers are contributing to seal level rise as well. Many glaciers distributed throughout the world have lost anywhere from 1Gt to 100 Gt per year. Their lines of ablation are retreating sometimes more drastically than researchers expect. This map shows the mass balance of glaciers as of last year, and a trend of shrinking is clear from the loss of these glaciers.

It is clear that the cryosphere is straight up melting. It has a large impact on sea level rise. Whether it is glaciers, continental ice sheets, or river ice causing damage to homes, something needs to be done. It has been said the IPCC is alarmist, but I have taken the journey myself to look at this data, and I see what they see- the writing on the wall. Even if these models are generous, we can see rates of ablation increasing, and we can see ice calving off in large amounts. The planet is changing, and the evidence is in the ice.
3. PaleoClimate
Part three of my four part series on the IPCC is about paleoclimate: Chapter five. Otto Bliesner visited CU Boulder to personally deliver the message in the multi-part CIRES seminars, and this chapter says a lot by looking at the earth’s history, most notably through ice cores. Chapter five is where much of the evidence comes in to proving that the temperature has increased because it shows that Earth’s natural cycles have been disrupted. Weather it is tree rings, ice cores, permafrost, or other records, the evidence points to a gap between what should be happening (what we could reasonably expect from records and Earth’s experience), and what is.
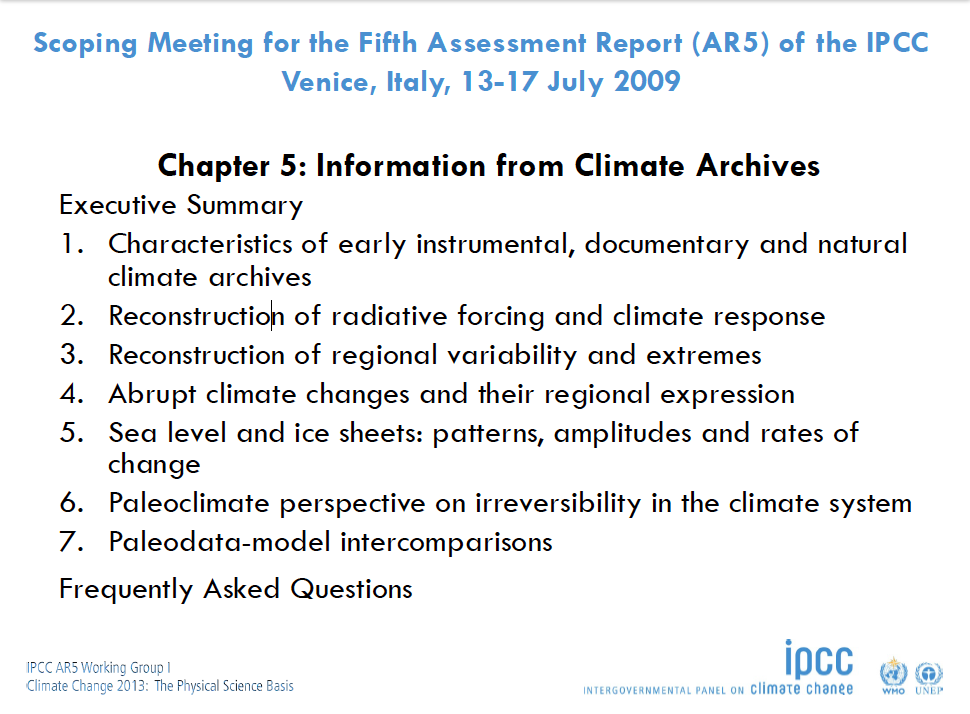
Part three of my four part series on the IPCC is about paleoclimate: Chapter five. Bette Otto-Bliesner visited CU Boulder to personally deliver the message in the multi-part CIRES seminars, and this chapter says a lot by looking at the earth’s history, most notably through ice cores. Chapter five is where much of the evidence comes in to proving that the temperature has increased because it shows that Earth’s natural cycles have been disrupted. Weather it is tree rings, ice cores, permafrost, or other records, the evidence points to a gap between what should be happening (what we could reasonably expect from records and Earth’s experience), and what is.
The Past can Inform the Future

So how can the past inform the future? David Hume concludes that our knowledge of cause and effect is based on experience. Philosophical ambiguity aside, if we can say that if we believe that cause and effect can be predicted by experience, than we can use paleoclimate records to show how glacial and interglacial periods of old tell a different story than the one playing out now. The AR4 was the first time paleoclimate had a chapter it itself. The IPCC realized the importance of paleoclimate data, specifically relating to if 20th century warming is unusual based on the data they collected. The data collected rages in time from the Paleocene-Eocene Thermal Maximum (PETM) to the pre-industrial period (before 1850).

It’s not the Sun and It’s not Volcanic Activity
The first relevant set of models is the reconstruction of radiative forcings done through ice cores. One variable worth noting is the sun, which was proven to have much smaller variability for the last millennium than earlier reconstructions. Blaming climate variability on the sun is a known tactic for those who would deny the science suggesting anthropogenic causes of climate change. The other radiative forcing significant for a summary is the volcanic record. Another commonly touted cause by climate skeptics, many say it is the volcanoes and not humans that are putting CO2 in the air. Volcanoes do pump CO2 into the atmosphere, but to put it into perspective, human emissions are equivalent to a Mt. Pinatubo eruption every 12.5 hrs, year round. Mt. Pinatubo was .13Gt (Giga-tons) of CO2 in 1991, our emissions are 6Gt per year. The data from two reconstructions on volcanic activity show that the timing is similar, but the difference is in intensity of peaks. We know that volcanic activity contributes to global warming, but it couldn’t cause the intensity of effects without help from other sources.
CO2 Concentrations and Temperature
As for the direct CO2 measurements, the IPCC leaves no room for interpretation in their language
““It is a fact that present-day (2011) concentrations of the atmospheric greenhouse gases (GHGs) carbon dioxide (CO2), methane (CH4) and nitrous oxide (N2O) exceed the range of concentrations recorded in ice cores during the past 800,000 years.””
There you have it, straight from the horse’s mouth. Since the AR4 improvements have been made to the models, and the correlation of CO2 concentrations and polar amplification was reported with high confidence in the new models.
Temperature and Weather Events in the last Millennium

When looking at the recent data in the Northern Hemisphere, it was reported that 1983-2012 was very likely the warmest period in the last 800 years; the data also shows it was likely the warmest period in the last 1,400 years. As far as the last millennium’s other forcings, volcanic impact was greater on CO2 concentrations than solar variability. Isolated events are not enough to have caused this severe of a change, but more and more events show a trend of instability. Extreme weather events are said to be one of the markers that climate is changing rapidly. It was mentioned that mega-droughts (a drought lasting two years or longer) were found of greater magnitude and duration than those observed since the beginning of the 20th century. With drought occurring in the wetter places, the more arid places such as central Asia and South America have experienced more monsoons as well as (as we discovered before) more precipitation.
Sea Levels are Rising too Rapidly

Sea level rise may be one of the more alarming aspects to climate change. With more than 44 percent of the world’s population living on coastlines, changes to the landscape, in some places even a few feet, could have catastrophic consequences. The AR5 has addressed this by comparing paleo sea level with todays, “The rate of sea level rise since the mid-19th century has been larger than the mean rate during the previous two millennia (high confidence). Over the period 1901 to 2010, global mean sea level rose by 0.19 [0.17 to 0.21] m.” In addition, the IPCC warns that the rate of mean sea level change is unusually high in the context of centennial scale variations of the last two millennia.
We can use the past to inform the future, especially with sea level change as outlined in Bliesner’s presentation about the paleoclimate chapter. Most notably, there is a correlation between long term sea level and given temperatures found in the paleo record. With an examination on everything from evidence to mitigate the sun and volcanic activity as major causes, to looking at CO2 concentrations and temperature correlations of the last millennia we can surmise the data makes sense for anthropogenic causes. Further, the effect these causes have on sea level change is significant and very relevant to nearly half the world and the policymakers who manage that area. The IPCC has summarized paleoclimate simply, and with this information it will be easier to integrate all information for a reliable scientific document for policymakers and the public to stay informed.
1. Climate Science, meet Politics. An Administrative Primer on the IPCC AR5 Report
The Intergovernmental Panel on Climate Change (IPCC) has recently published its fifth iteration of a collaborative report on global climate for international policymakers (The AR5). The report is an informative, but non-prescriptive body of data that makes clear three major points - climate change is real, humans are causing it, and every moment we ignore it the problem gets worse.
Although I would not argue with those statements, I was interested to find out more about the administrative aspect of the IPCC before granting them credibility. The IPCC is as much a political organization as it is a scientific one. A baseline understanding of the administrative side of the IPCC allows for a more robust perspective into their process, a perspective I see as required as context for any scientific details. The CIRES seminar on the IPCC report provided some answers to a few basic questions I had after being introduced to the IPCC. Namely, why did it take so long to get a definitive statement on the climate issue, and why did we need five reports spanning 14 years to paint the picture? Also, how and why would the issue of oversight be the deciding factor for the soundness of report? Lastly, and what was different about the AR5 report versus past ones and why should we care about all those pages?
“Human influence has been detected in warming of the atmosphere and the ocean, in changes in the global water cycle, in reductions in snow and ice, in global mean sea level rise, and in changes in some climate extremes (see Figure SPM.6 and Table SPM.1). This evidence for human influence has grown since AR4. It is extremely likely that human influence has been the dominant cause of the observed warming since the mid-20th century. {10.3–10.6, 10.9}”
Never Underestimate the Power of Language in the Climate Debate
Past reports, it seems, have been made timid by governments aligned so closely with economic interests they would have us believe that excess atmospheric CO2 is good for trees and that global warming gives us more options for tropical travel. So with each iteration of the report gaining momentum, the wording and tone has become more confident and definitive. With more attention on global climate change and the IPCC than ever, the IPCC has to be very careful how their report is worded in order to best guide its interpretation with the media and with the public. This point about how important wording is made clear by a comment given during the first IPCC Summary at CIRES [The IPCC creates this document, and in the revision process policymakers meet to revise the document.]
“In these meetings about 85% of the time is arguing over wording and 15% of time governments are trying to change the conclusions. The scientists are there to make sure science doesn’t change and ideas are communicated clearly.”
"Calibrated Uncertainty" IPCC Report Page 55
In addition to the stringent process of perfecting the phrasing of the report, they [the IPCC] have come out with a language key to clarify the findings of the report. It is not an easy thing to try and apply qualitative descriptors to quantitative data, but the IPCC tried it in what they call “Calibrated Uncertainty.” This language key, the IPCC believes, will allow the media and the public to interpret and understand the data better. Further, this language gives the scientists who worked on the report a consensus dialect spanning disciplines and cultures.
Linda O Mearns, Presenter for the second in the CIRES IPCC series, cited some very interesting findings reported on how probability language used in the IPCC's Calibrated Uncertainty program is interpreted. In a multinational (24 countries) study to understand how people understand probability language about 10,000 participants (average Joes, not policy people) were given the reports to read. They were given two scenarios to read the probability statements.
Comprehension and agreement of probability language with and without numerical value attached. Quite a range of answers on what "extremely likely" means.
1) given the phrases as presented in the IPCC documents (e.g., it is very likely that heat waves will continue to increase), with a link to the quantitative details (i.e., the table with verbal phrase and corresponding quantitative measure – very likely, > 90%) (Translation case)
2) given sentence from IPCC but with quantitative information incorporated in the sentence – ‘it is very likely (> 90%) that frequency of heat waves will continue to increase’ (Verbal-numerical case).
The study concluded that using both the language and the actual probability contributed to the greatest understanding of the data. So is the probability language created so the layman can understand the scientists, or is it created as a consensus and clarification vehicle for the scientists themselves? Whatever it's intention the interpretation of the data is as diverse as language itself.
Room for Improvements to the Review Process from Previous Reports
There are several improvements in the AR5, including a more transparent and collaborative review process and more efficient timescale. There are also some improvements to the as well treatment of scientific data. The review process has been carefully refined from previous reports. This process was revamped as a result of incorrect information finding its way preceding reports. In 1995 charges alleged that authors had made changes on their own, and although the charges were unfounded, authors were attacked by media and critics. The tendency of the media and other politically affiliated stakeholders to bring into question the ethics of scientists is a timeworn tactic.
During the publication of the AR4 in 2009, when there was a peak interest in climate change, emails were stolen from an IPCC server and lead authors’ emails were cited out of context. IPCC Investigations have cleared scientists of any wrongdoing, and the science from those reports still stands, but it does offer us in the science world some important lessons about how careful one needs to be portraying simple, perhaps unpopular truths. Additionally in the AR4, there were two errors in the text on Working Group 1, a discrepancy about what a Himalayan glacier meant, and the area of the Netherlands below sea level. Because of this, a better errata procedure was established. In the AR5, there are two stages of review with 1500 traceable comments. In this report, review editors (2 per chapter) were assigned to oversee the review and editing process and stand between lead authors and critics to explain and defend the review process.
Jerry Meehl Slides on Timelines of the IPCC AR5 Report
Timelines and Draft Reviews
It is clear that much more attention has been paid to language, phrasing, and oversight by the scientists, but what have they been doing since 2009?
What Does it All Mean? (skip here if you are looking for the short version)
An excerpt from the paper asserts:
“It is extremely likely that more than half of the observed increase in global average surface temperature from 1951 to 2010 was caused by the anthropogenic increase in greenhouse gas concentrations and other anthropogenic forcings together. The best estimate of the human-induced contribution to warming is similar to the observed warming over this period. {10.3}”
If the impossibly long IPCC report could be summed up in two sentences, these would be it. This year’s smoking gun statement is not only bolder than previous assertions, it is more urgent. It represents the IPCC’s collective agreement to not only assert humans as the cause of global warming, it puts responsibility on people and governing organizations to act. In theory, the symbiotic relationship of science and politics make perfect sense, but in the real world it is nearly unheard of. The IPCC is one such organization that, despite their kinks, seems to be working for a global cause and doing so relatively peacefully. Administratively, each report grows more detailed and gains more layered oversight than the previous. Now that we know how the IPCC works, lets look at what they have done with the science in Part 2.